Yale SARS-CoV-2 Genomic Surveillance Initiative
This report shows preliminary results related to 15 new SARS-CoV-2 genomes from clinical samples collected in Connecticut between March 26 and April 11, 2020. These samples were sequenced by Joseph Fauver and Tara Alpert, using a MinION platform and an ARTIC protocol. Phylogenetic analysis were performed by Cole Jensen, and results were interpreted and described here by Anderson Brito. The results reported in this update were obtained using a nextstrain pipeline, and can be also visualized here. This COVIDTracker website was developed and is maintained by Chaney Kalinich.Data
The directoriesconsensus_genomes and metadata in our GitHub repository contain all of our current SARS-COV-2 genomes and metadata.
Interpretation
⚠️ WARNING: These results should be considered as preliminary data, as they may change in light of new evidences.Dataset
We combined our new dataset of 15 SARS-COV-2 genomes with other 70 genomes reported by our team in the Update 3. Figure 1 below shows where genomes released by the Yale SARS-CoV-2 Genome Surveillance Initiative were collected. To perform preliminary analysis, we also downloaded other 480 genomes available on GISAID, from around the world and the US, to uncover recent patterns of viral spread within and from Northeastern USA in the past weeks. We thank the authors of the genomes in that complementary dataset: a list of authors is provided at the bottom of our dedicated nextstrain page.
SARS-COV-2: lineages A and B
Genomes sequenced by our team are found in both major SARS-CoV-2 lineages: lineage A and B (highlighted in Figure 2). These lineages are further divided into nested sub-lineages. In lineage A, most of our viral genomes cluster within the lineage A1 and the sub-lineage A1.2. In lineage B, the biggest group among SARS-CoV-2, our sequenced genomes cluster within B1 (sub-lineages B1.3, B1.11) and B2.
Introductions of lineage A viruses, and their transmission chains in CT
Among the 85 genomes sequenced by our team over the past 4 weeks, only 19 (around 22%) belong to lineage A. In this lineage, at least two introductions (most likely from Eastern Asia) lead to sustained transmission chains in North America. In the largest one, labeled in Figure 3 as lineage A1, one can find genomes extracted from viruses circulating in Canada and all four major US regions, mainly in the West (WA state). Local introductions of lineage A1 viruses into Connecticut took place mostly in March. In this current update, only one new genome (Yale-080, upper arrow in Figure 3) was detected in that North-American cluster (A1). Outside lineage A1, a small cluster of genomes collected in Northeastern USA starts to be more evident. Among these viruses is the newly sequenced genome Yale-088 (lower arrow) and other genomes from CT and NY.
Lineage B1: predominant in New York state
In this update, most sequenced genomes were extracted from viruses belonging to lineage B1 (Update04, in Figure 4), a large group of genetically related viruses mainly found in the USA, but also in Europe, and less frequently in other continents. Nearly 75% (63 out of 85) of all genomes sequenced by our group are found in this cluster (Figure 4). Lineage B1 is now mainly composed by viruses from Northeastern US, especially from New York. Genomes from West, Midwest, and Southern US states are also observed in this cluster, indicating constant spread between NY and other US regions (Figure 5, right panel). Current outbreaks in Connecticut are primarily seeded by viral introductions from New York City.

Sub-lineage B1.3: the NY-CT cluster
Among our newly-sequenced genomes, one-third (5 out of 15) are found in the sub-lineage B1.3, a growing cluster of genomes closely related to NY genomes (Figure 6). Based on data available so far, such scenario of a growing B1 cluster reinforces the central role of NY as a source of viruses causing outbreaks in CT.
The bottom line
Using genomes extracted from patients residents of Connecticut (Figure 7), genomic epidemiology reveals that over the past weeks outbreaks in the state (and all over the USA) have been mostly caused by SARS-CoV-2 lineages spreading from state-to-state, and coast-to-coast. Given that outbreaks are still taking place in major urban centers, and considering that most of the population in the country is still susceptible to the virus, policy makers must consider the epidemiological data and information on viral dynamics to plan safe reopening strategies. Such data, coupled with large scale testing are essential to prevent second waves of viral transmission, which have the potential to bring us back to the current scenario of closure.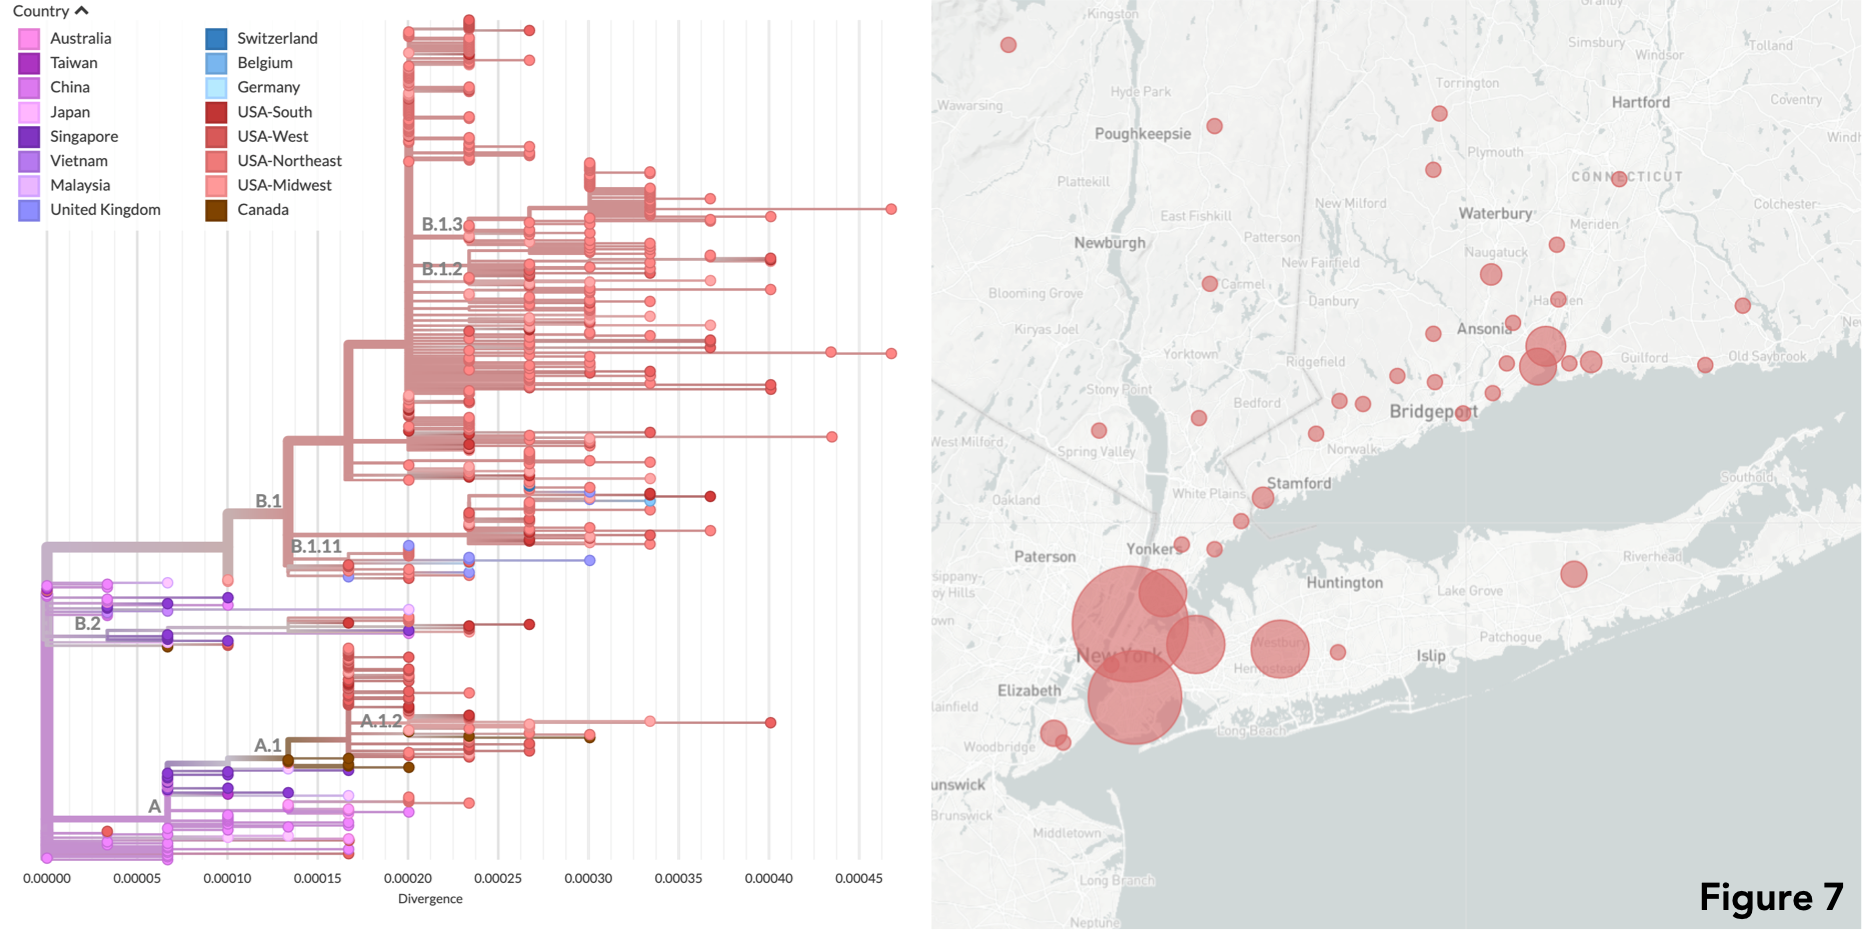 On our Github, the directory
 auspice contains a json file that was produced using the augur nextstrain pipeline.
See results on Nextstrain →
Grubaugh Lab | Yale School of Public Health (YSPH) | https://grubaughlab.com/
